Discover the connections behind the market.
A knowledge graph of the market, with millions of nodes and tens of millions of connections, updated around the clock. More than 400 pattern recognition algorithms run on it to find the connections no screen would show.
What it does for you
Beyond the headline.
-
Discover hidden connections
Find the relationships and exposures conventional research can overlook: the supplier two steps away, the shared lender, the customer that quietly changed rank.
-
Trace market implications
Understand how an event propagates across companies and industries, one connection at a time, with the evidence for each step.
-
Monitor meaningful changes
Know when a new development affects your investments or the assumptions behind them, and why.
400+ pattern recognition algorithms
Pattern recognition on the graph, as building blocks.
Each pattern recognition algorithm is a building block. The research agent, your automations and discovery runs call them to detect patterns and find connections that are not obvious.
What is a building block?-
Macro analysis
“Which companies and industries does this rate decision reach, and how strongly?”
- Knowledge graph
- Events & macro
-
Risk assessment
“Which supplier, lender or customer do several of my holdings quietly share?”
- Knowledge graph
- Risk & trading
- Portfolio
-
Competitor analysis
“Who competes for the same customers and suppliers, and how is that set shifting?”
- Knowledge graph
- Fundamentals & filings
-
Narrative changes
“Is the story around this theme starting to change, and which companies does it reach?”
- Knowledge graph
- Research & web
-
Non-trivial dependencies
“Which companies two or three steps away does this holding quietly depend on?”
- Knowledge graph
- Portfolio
How it works
From a market change to what it means for you.
-
01
Sources, read around the clock
Filings, earnings calls, news, regulators, prices and macro releases.
-
02
The map updates
Companies, products, countries, people, regulators, organisations and events are written in, dated and sourced. Each connection has a strength that grows with evidence and fades as it goes stale.
-
03
Effects are traced
Through suppliers, customers and lenders to the companies the change reaches.
-
04
Theses are re-checked
Each thesis that rests on an affected company is marked as holding, weakened or broken, with the reason.
-
05
A cited brief lands
In your workspace, and the change stays under watch.
On real companies
Connections a screen would not show.
Insights published from the Clargus graph: the connection, the evidence behind it, and the chart.
-
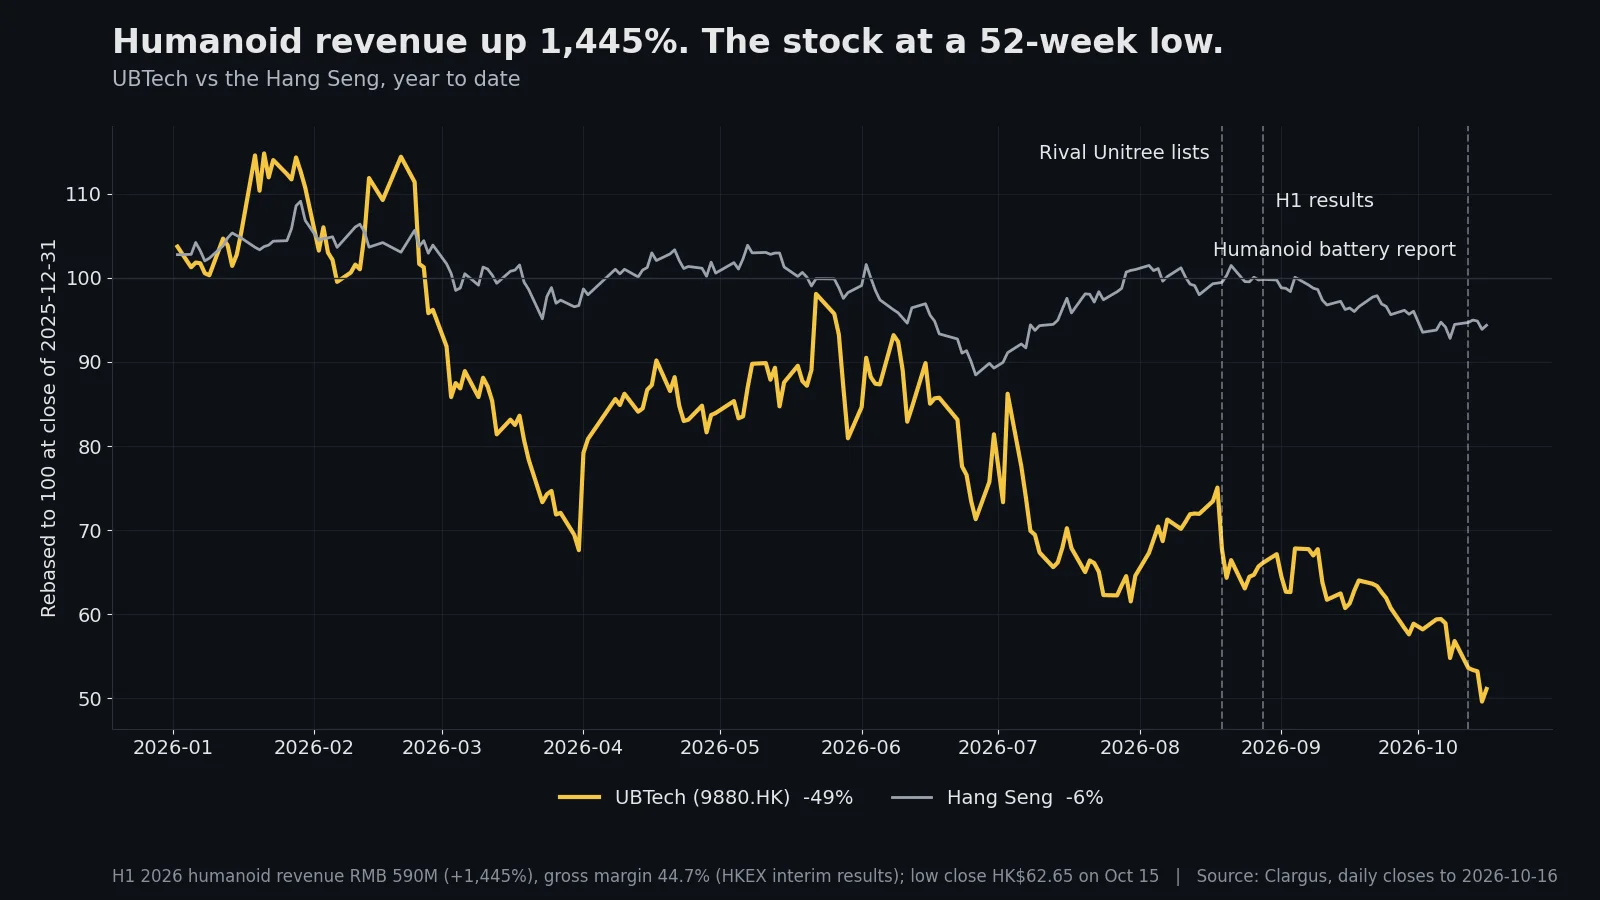
MECHANISMOct 18, 2026
Humanoid robots burn through batteries. UBTech owns the fleet.
A humanoid robot charges its battery more times in a week than your car does in a year. The leaders fixed runtime by swapping packs, and that turns the battery into a consumable.
Read the insight -
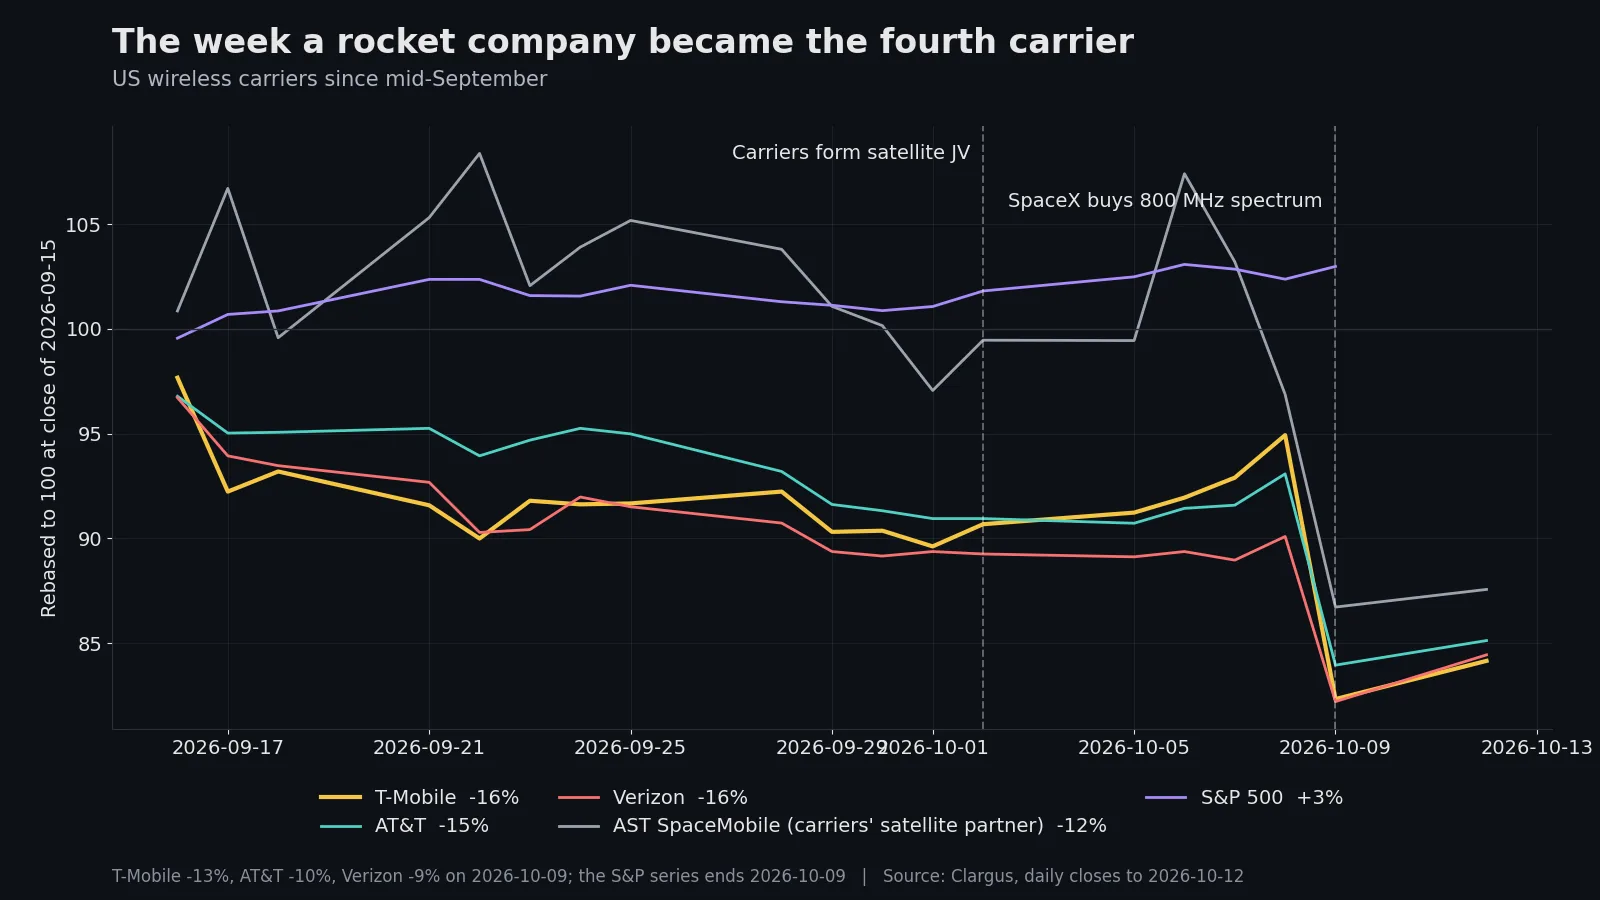
REPRICINGOct 13, 2026
SpaceX bought spectrum, and T-Mobile fell 13% in a day
Your phone company lost 13% in one day. Not because of earnings. Because a rocket company bought radio spectrum, and the carriers’ own satellite partner was outbid for the same band.
Read the insight -
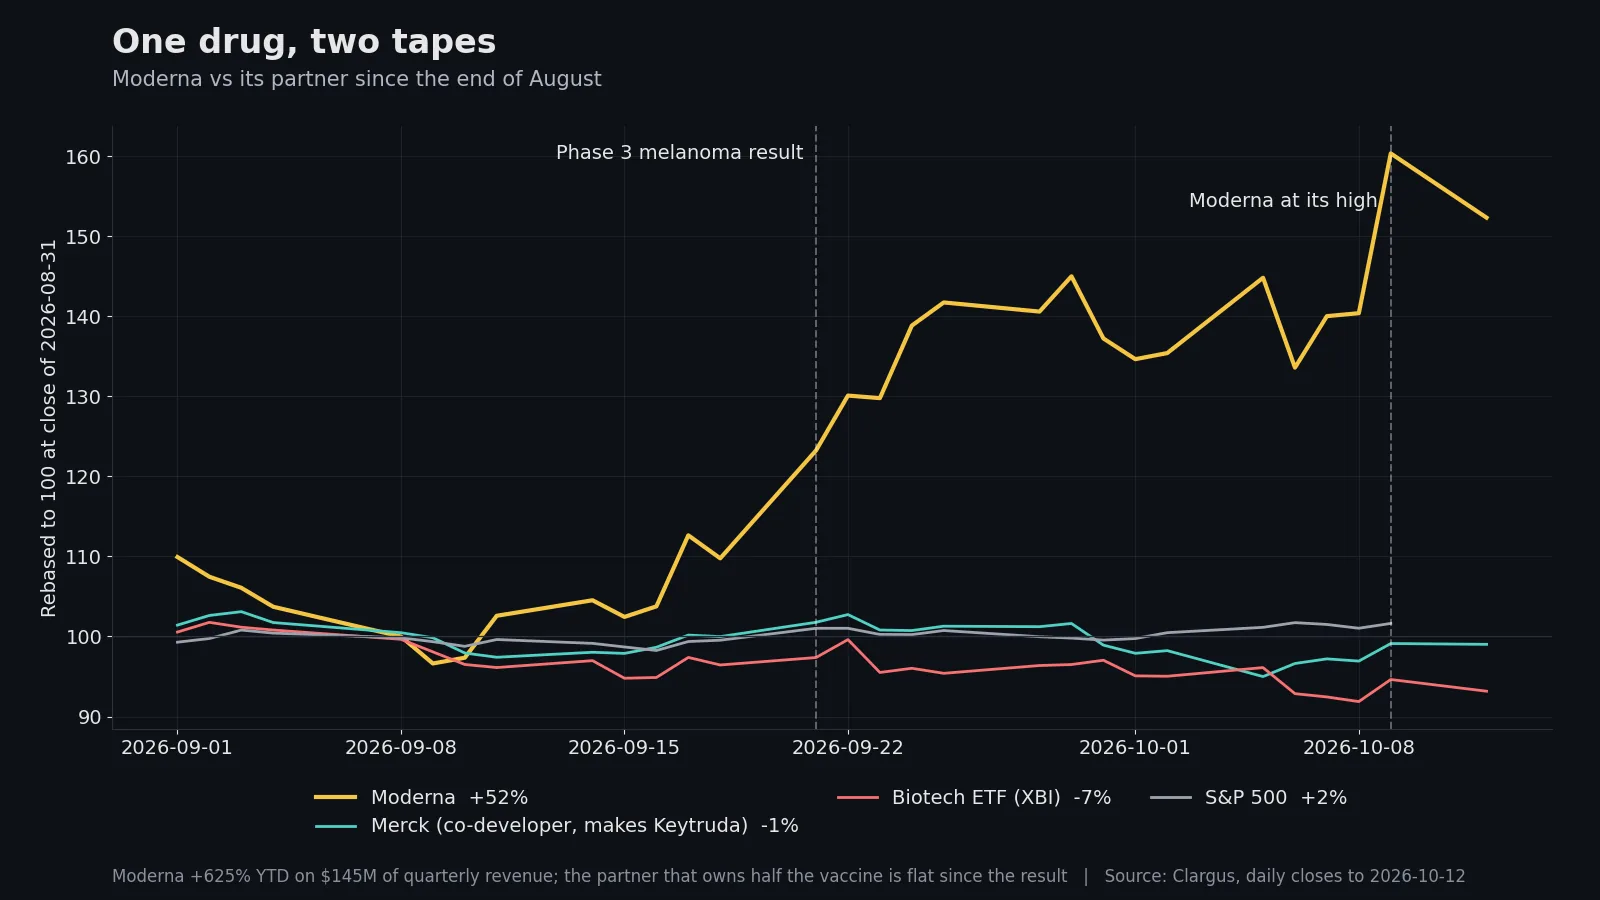
PAIR DIVERGENCEOct 13, 2026
Moderna is up 600% on a cancer vaccine. Its partner Merck hasn't moved.
Moderna’s revenue fell from $18 billion a year to $145 million a quarter. The stock is up more than 600% this year. The company that owns half of the reason has not moved.
Read the insight
See what matters. When it matters.
Be the one in the room who saw it coming.